Codeflix

Understanding the difference between business intelligence and business analytics is essential for organizations aiming to turn data into measurable business value. While both fall under the same category of a larger data umbrella, they cater to various decision-making timelines. In simple words, business intelligence specializes in what has already happened. while business analytics deals with what might happen in the future. It is a classification between descriptive reporting and predictive or prescriptive modeling. Knowing about this distinction is key in terms of finalizing the right tools, hiring the right talent, and giving importance to initiatives that align with our business goals 

In this blog, we’ll explore definitions, capabilities, tools, use cases, governance, and future trends so that you can confidently decide when to focus on BI or where to move into BA, and in some scenarios, how effectively we can integrate both for the greatest impact


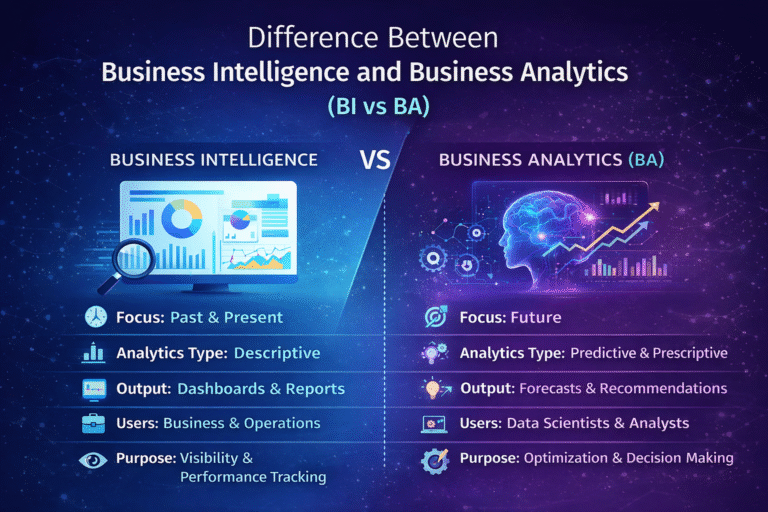
Quick Summary: Business Intelligence vs Business Analytics

Business Intelligence (BI): This is often about descriptive and diagnostic analysis. It collects data from various sources, cleans it up, and shares it through dashboards and reports to explain what has happened and why.

Business Analytics (BA): This is generally more towards predictive and prescriptive analysis. It uses machine learning, statistical models, and optimization techniques to predict future outcomes and provide a plan of action

If your motive is to gain operational visibility and track performance, then BI is your choice. On the other hand, if you are looking to find out what will happen and enhance decisions, BA is the best option.

What is business intelligence? (BI)

Business intelligence deals with the collection, organization, and visualization of both past and current data to make decisions. BI supports answering questions like

– What happened last quarter?
– Which items are performing better?
– Where exactly do we fall short of our targets?
– Which segments or areas are trailing behind, and why?

Core Components of BI

Data Integration & ETL/ELT: This process involves gathering data from CRMs, ERPs, web analytics, and transactional systems and then shaping it into a usable format.
Data Warehousing: A major hub for organized data, ensuring proper reporting and analysis.
Semantic Layer & Data Modeling: This typically creates business-friendly definitions for key metrics, such as revenue and churn rate, ensuring everyone is on the same page.
Reporting & Dashboards: These are visual tools that provide key performance indicators (KPIs), trends, and detailed segment breakdowns.
Self-Service Analytics: This supports business users to create their self reports while still keeping everything in check with proper governance.
Outcomes BI Enables:
– A single trusted source of data
– Real-time or almost real-time operational monitoring
– Reporting for executives and boards
– Performance management driven by data
 
In a nutshell, Business Intelligence (BI) brings trusted facts about your business, both present and past, which helps segregate the difference between business intelligence and business analytics: BI is all about the descriptive layer.
 

What is business analytics? (BA)

Business analytics is not normal reporting; it goes further beyond by predicting future outcomes and providing a plan of action. It tackles questions like
 
– What’s going to happen in the next phase?
– Which clients might churn?
– What price should we finalize to maximize our returns?
– Which interventions will give us the maximum ROI?
 

Core Components of BA:

Predictive Analytics: Using statistical and machine learning models to predict what’s next.
Prescriptive Analytics: These are optimization models that suggest the best plan of action we need to take.
Scenario & Sensitivity Analysis: Running “what if?” simulations based on various theories.
Feature Engineering & Model Lifecycle: This involves building, validating, monitoring, and retraining models.
 

Outcomes BA Enables:

BA is all about moving from insight to foresight, which is at the heart of the distinction between business intelligence and business analytics.
 
– Forecasting and demand planning
– Marketing attribution and uplift modeling
– flexible pricing and revenue optimization
– Thread evaluation and fraud detection
– Supply chain optimization
 
BA is all about moving from insights to foresight, which is at the center of the achievement between business intelligence and business analytics
 

Key Differences Between Business Intelligence and Business Analytics:

Key Differences Between Business Intelligence and Business Analytics

Time Orientation:

 BI: Looks at the old and current (descriptive/diagnostic).
 BA: Focuses on the future (predictive/prescriptive).
 

Question Types:

 BI: “What happened? Why did it happen?”
 BA: “What will happen? What should we do?”
 

Techniques:

BI: Reporting, dashboards, OLAP, slicing/dicing.
BA: Statistical modeling, machine learning, optimization.
 

Data Types & Complexity:

BI: Mainly organized data with proper metrics.
BA: A combination of structured, semi-structured, and unstructured data, providing quality features.
 

Users:

BI: Business users, operations teams, executives.
BA: Data scientists, analysts, and decision scientists.
 

Outputs:

BI: dashboards (KPI), merit cards, and reports in either PDF or Excel
BA: Forecasts, propensity scores, suggestions, and optimal plans.
 

Value Horizon:

 
BI: Focuses on visibility and governance.
BA: Targets for a competitive edge through guesswork and optimization
 
Understanding the difference between business intelligence and business analytics is crucial for selecting the correct approach to inform your decisions.

Common Overlaps and Misconceptions

Overlap: BA depends on solid BI. Clean, governed data from BI systems is the asset of effective analytics.
Misconception: Many of them think that BI is basic, while BA is advanced. but the fact is that achieving BI maturity and ensuring data governance can be a more hectic task than building a single model, and both are important.
Overlap in Tools: Many platforms, like cloud analytics suites, support both BI dashboards and integrated ML features.
Misconception: Dashboards alone drive decisions. While they inform, BA takes those insights and turns them into prioritized actions with measurable impacts.
Overlap in People: Today’s analytics engineers connect BI modeling (semantic layers) with BA pipelines. linking metrics to machine learning features.

Benefits: BI vs BA

BI Benefits:

 
– Unified metrics and definitions
– Operational transparency and accountability
– Quicker, self-service reporting
– Minimal ad-hoc data requests
– Compliance-ready audit trails
 

BA Benefits:

 
– Better forecasting accuracy
– Resource allocation based on data-driven.
– Personalized customer experiences
– Less risk and fraud
– Better margins through optimization and pricing strategies.
When considering BI vs. BA, remember that combining the two can lead to even greater benefits: BI enables business analytics, while BA enhances the business value of BI.

Tools and Technology Stack

While the specific tools may change over time, the general stack usually looks something like this:
 

BI Stack

 
Data Integration: ETL/ELT tools and data pipelines
Storage:  Data warehouses and lakehouses, focusing on organized data
Modeling: Semantic layers and dimensional modeling
Visualization: Dashboards, reporting tools, and embedded analytics.
 

BA Stack

 
Data Science Frameworks: Python/R, notebooks, and ML libraries
Feature Stores & MLOps: Model training, versioning, deployment, and monitoring
Optimization Engines: Linear and nonlinear programming, along with heuristic algorithms
Experimentation: A/B testing platforms and causal inference tools
 
Many organizations opt for platforms that encompass both areas, enabling a solid approach to understanding the distinction between business intelligence and business analytics.

Data Maturity Stages: When to Use BI or BA

Stage 0 – Fragmented Data:

 
– Focus on the basics of BI: data integration, quality, and governance.
– BA applications are premature without trusted data.
 

Stage 1 – Centralized Reporting:

 
– Broaden BI efforts: standardized KPIs and self-service dashboards.
– Start pilot BA projects using clean datasets (like simple forecasts).
 

Stage 2 – Analytical Scaling:

 
– Develop mature BA practices: various models, MLOps, and continuous training.
– BI acts as a monitoring tool for BA outcomes (for example, comparing uplift vs. control).
 

Stage 3 – Decision Automation:

 
– BA operates prescriptive models that are integrated into daily operations (like pricing and routing).
– BI assures oversight, compliance, and performance auditing.
 
Advancing through these stages helps clarify the roadmap for business intelligence versus business analytics in your organization.

Use Cases by Industry

Retail & E-commerce

 
BI: Analyzing sales performance by category, inventory turnover, and channel profitability.
BA: Demand forecasting, flexible pricing, suggested systems, and churn prediction.
 

Financial Services

 
BI: Monitoring branch performance, loan portfolio dashboards, and compliance reporting.
BA: credit scoring, fraud identification, risk monitoring, and portfolio optimization.
 

Manufacturing

 
BI: Think production yield, quality metrics, and downtime reporting.
BA: In this, we will explain predictive maintenance. storage planning, and enhancing the supply chain.
 

Healthcare

 
BI: Picture patient volume dashboards, cost center reporting, and metrics on medical/clinical outcomes.
BA: This adds readmission risk models, staffing optimization, and individual care pathways.
 

Telecom

 
BI: concentrate on network uptime, customer service KPIs, and trends in ARPU.
BA: Here, we check the churn prediction. the next-best offer, and predicting network traffic.
 

SaaS/Tech

 
BI: Major metrics like MRR/ARR, cohort retention, and support ticket analytics come into play.
BA: This involves lead scoring, finding LTV, optimizing pricing, and modeling feature adoption.
 
These instances clearly show the difference between business intelligence and business analytics in a simple way to understand.
 

Metrics and KPIs: BI vs BA

BI-Focused KPIs:

 
– Profit, margin, and cost to set up.
– Conversion rate and average order value
– Net promoter score (NPS) and customer happiness.
– Inventory turnover and forecast accuracy (as a monitored metric)
 

BA-Focused Outputs & Metrics:

 
– Forecasting demand by SKU/region (including intervals and point forecasts)
– Propensity scores (Likely to buy, churn, or commit fraud)
– Uplift metrics (measuring the incremental impact of interventions)
– Optimization objective values (like ROI, cost, and service level)
 
By joining BI dashboards with BA outputs, stakeholders gain a comprehensive view that spans from performance monitoring to decision-making guidance—this is the core of BI vs BA

Team Roles and Skills

BI Team: It includes data engineers, business intelligence developers, analytics engineers, data stewards, and business analytics.
BA Team: It includes data scientists, ML engineers, decision scientists, and experimental leads
 

Key Skills:

 
BI: Proficiency in SQL, data modeling (star/snowflake), visualization best practices, and governance.
BA: Skills in statistics, machine learning, Python/R, causal inference, optimization, and MLOps.
 
Understanding team structures helps operationalize the difference between business intelligence and business analytics.

Implementation Roadmap

Define Outcomes: Join your initiatives to clear business goals—like aiming to reduce churn by ten percent or boosting forecast accuracy to 85%
Data Assessment: Conduct a comprehensive review of your data sources, evaluating their quality and accessibility, and identifying any necessary governance requirements.
BI Foundation: Create semantic models and dashboards that highlight your core KPIs, establishing a single source of truth.
BA Pilots: Begin with small-scale projects that have a huge impact, such as predicting churn, demand, or fraud, and keep track of the improvements.
MLOps & Scaling: Roll out your models, keep an eye on any drift, retrain them regularly, and ensure they align with your operational systems.
Change Management: Providing assistance for end-users and integrate BI dashboards and BA recommendations into everyday workflows.
Measure ROI: Monitor cost savings, profit increases, and reductions in cycle times; adjust your approach based on what the data shows.
 
This roadmap highlights the differences between business intelligence and business analytics while bringing them together for greater success.

Governance, Security, and Compliance

Data Governance: Establish definitions, monitor data lineage, perform quality checks, and activate access controls.
Security: Execute role-based access, ensure encryption both at rest and in transit, and take care of secrets effectively.
Compliance: Stay up-to-date with industry and regional regulations—like those in healthcare and finance—while maintaining audit trails and ensuring model explainability.
 
Solid governance builds trust in BI and accountability in BA. bridging a balance between business intelligence and business analytics. 

Cloud, Real-Time, and AI Impact

Cloud Adoption: Using elastic storage and computing can reduce costs and improve analytics.
Streaming/Real-Time: This enables operational dashboards (BI) and facilitates quick decision-making (BA), such as conducting fraud checks during transactions.
AI Enhancements: Automate data quality checks, feature generation, and model selection; use AI assistants for natural language queries.
 
These innovations are blurring the lines, but understanding the difference between business intelligence and business analytics in terms of goals—visibility versus actionability—remains critical.

Cost, ROI, and Pitfalls

Cost Drivers
  • Data warehousing and integration.
  • Tool licensing and cloud computing
  • Talent acquisition and training support
  • MLOps and monitoring infrastructure
ROI Levers
 
  • Boosting revenue through personalization, smart pricing, and cross-selling
  • minimizing costs with automation and optimization
  • preventing risks and enhancing compliance efficiency
  • Speeding up decision-making while ensuring consistency.

Common Pitfalls

Neglecting BI: Diving into BA without proper data results in weak models.
Metric Confusion: Inconsistent definitions lead to dashboards that lose credibility.
Model Dark Launch: BA outputs aren’t integrated into operations, leading to worse adoption.
Overfitting: Functions fine in the lab but struggles in real-world applications; keep an eye on drift and recalibrate as needed.
Change Fatigue: Lack of training and communication can wear teams down.
 
Knowing these pitfalls highlights why it’s essential to grasp the difference between business intelligence and business analytics for maximizing Return on investment.

Future Trends

Augmented Analytics: AI-based insights and automated anomaly detection.
Composability: Modular, API-first stacks that allow for immediate swaps and upgrades.
Data Products: Treating data pipelines and models like products with service level agreements.
Edge Analytics: making decisions nearer to data sources (like IoT and mobile), blending BI monitoring with BA triggers.
 
These trends emphasize how business intelligence and business analytics will continue to evolve together in tools while maintaining their unique purposes.

Conclusion:

The difference between business intelligence and business analytics boils down to visibility vs. foresight. BI normalizes and democratizes details throughout your organization, while BA looks ahead, suggesting actions that maximize impact. Making it business intelligence versus business analytics, the choice isn’t between one or the other. The best strategy is to embrace both, starting with proper, governed data and scaling into predictive and prescriptive models linked to business outcomes. If you’re just beginning, concentrate on BI fundamentals first: ensure data quality, establish consistent metrics, and create user-friendly dashboards. Then, pinpoint a high-impact BA pilot—like churn prediction, demand forecasting, or dynamic pricing—to demonstrate value. Over a long period, build a mature data ecosystem where BI and BA reinforce each other, delivering insights that are not only informative but also actionable.

FAQ

What is the difference between Business Intelligence (BI) and Business Analytics (BA)?

Business Intelligence (BI) focuses on analyzing historical and present data to explain what has happened and why, often using dashboards and reports. Business Analytics (BA) goes further by using predictive and prescriptive techniques — such as statistical models and machine learning — to forecast what will happen next and recommend actions.

Which should my business focus on first — BI or BA?

Most organizations start with BI because it helps establish trusted, clean data and provides visibility into current performance. Once data governance and reporting foundations are strong, you can expand into BA for forecasting future trends and optimization.

What tools are commonly used for BI vs BA?

BI Tools: Data visualization and reporting tools like Power BI, Tableau, and Qlik help monitor performance and create dashboards. BA Tools: Statistical and predictive tools like Python, R, SAS, and machine learning libraries are used for deeper analysis and modeling.

Do BI and BA use the same data?

Yes, both BI and BA work with data, but the purpose and techniques differ. BI typically uses structured historical and real‑time data for dashboards and descriptive reporting. BA uses structured and unstructured data, applying advanced analytics to uncover patterns and forecast outcomes.

Can Business Intelligence replace Business Analytics (or vice versa)?

No — they complement each other. BI provides the foundation of cleaned, governed data and performance visibility, while BA builds on that foundation to deliver predictive insights and strategic recommendations. Organizations often use both together for maximum impact.

Start Application

    Enquiry for:

    Eligible Candidates


    A bachelor's degree with an average of 50 percent or higher marks

    Basic understanding of mathematics and programming concepts

    Preferably, 2+ years of formal work experience

    This will close in 0 seconds

      Program Syllabus


      This will close in 0 seconds

        By providing your contact details, you agree to our Privacy Policy


        This will close in 0 seconds

          JobAssist Brochure


          This will close in 0 seconds

            Talk To An Admission Counselor

            By providing your contact details, you agree to our Privacy Policy


            This will close in 0 seconds

            Scroll to Top