- AI-Powered IT Operations (AIOps)
- AI-Driven Digital Transformation
- Data Visualization and Analytics
- Predictive Analytics
- Process Automation
- Natural Language Processing (NLP)
- IT Service Management (ITSM)
- IT Operations Management (ITOM)
- Customer Service Management (CSM)
- HR Service Delivery (HRSD)
- Governance, Risk and Compliance (GRC)
- Field Service Management (FSM)
- Custom Workflow Development
- Remote Infrastructure Management (RIM)
- Network Management Services (NMS)
- Cloud & Cyber Security Solutions
- OT & IOT Solutions
- Security Operations Center (SOC)

Data Visualization and Analytics
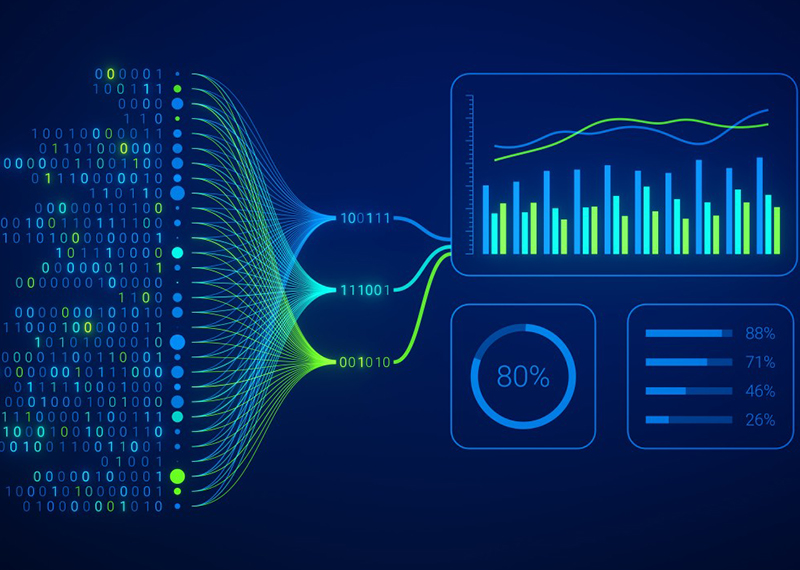
Data visualization is the graphical representation of data and information using charts, graphs, maps, and dashboards to help individuals and organizations understand complex datasets quickly. By transforming raw data into visual formats, such as bar charts, pie charts, and heatmaps, data visualization simplifies patterns, trends, and outliers that may not be immediately obvious in tables or text. This process not only enhances decision-making but also enables stakeholders to engage with the data more interactively, facilitating better communication and insight generation across teams. Businesses use data visualization to monitor performance, track KPIs, and inform strategic planning.
In addition to providing clarity, data visualization also drives deeper insights by allowing users to explore data from different angles. Advanced visualization tools, integrated with analytics platforms, can uncover hidden trends, correlations, and potential opportunities, empowering organizations to make data-driven decisions. Interactive visualizations and real-time dashboards allow for continuous monitoring, enabling businesses to respond swiftly to changes and challenges. By combining data visualization with advanced analytics, companies can uncover actionable insights that not only improve operational efficiency but also drive innovation, customer satisfaction, and competitive advantage.


